Research at KUDAR
The Ancient Maritime Dynamics (AMD) Project
The Ancient Maritime Dynamics (AMD) project has grown since its beginning in 2015 at the University of Birmingham, England, and encompasses a growing dataset of submerged assemblages, the continual testing and refinement of its interpretive methodology, a variety of geo-spatial analyses with Geographic Information Systems, and archaeological field surveys.
Background

The AMD Project began in 2015 under the direction of Matthew Harpster, emerging from the results of his MISAMS (Modeling Inhabited Spaces of the Ancient Mediterranean Sea) Project supervised by Leslie Brubaker and based at the University of Birmingham, England, from 2013 to 2015. The MISAMS research was generously supported by a Marie Sklodowska Curie IEF grant from the European Commission, and built upon two premises. First, that a widespread practice in maritime archaeology of applying fixed or normative labels such as ‘Phoenician’ or ‘Mycenaean’ to wreck assemblages on the seafloor has the same interpretive problems as the application of such identities to objects from other archaeological contexts. Wrecks from the 5th century BC are not necessarily ‘Greek’ because their cargo was from Athens, nor was Mediterranean maritime space only populated by ships with geo-political or geo-cultural identities.
MISAMS’ second element was a response to this deconstruction. If labels such as ‘Roman’ or ‘Rhodian’ were not always valid ways of perceiving or portraying wreck assemblages from antiquity, then how could they be labeled? Perhaps one alternative could emerge from their patterns of activity, based upon the archaeological dataset. Investigations begun prior to the MISAMS project suggested so. By plotting the locations of 455 submerged assemblages from A.J. Parker’s 1992 catalogue, Ancient Shipwrecks of the Mediterranean and Roman Provinces, then connecting the location of each assemblage to the source or sources of items in that assemblage with color-coded links, spatial patterns of activity arose. Within this collection, approximately 90 percent of the assemblages within the Western-Mediterranean basin, for example, contained items only from that basin; similar patterns arose for assemblages in the eastern Mediterranean, or the Adriatic and Aegean. (With a different approach, Sean Kingsley drew similar conclusions in 2009) Archaeologically, there appeared to be a narrative of western-Mediterranean, central, or eastern-Mediterranean seafaring. The wreck assemblages, then, could be identified by their regions of activity, not with particular cultural, political, or ethnic affiliations.


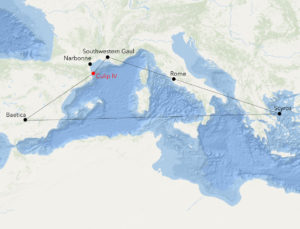
These conclusions generated prior to the MISAMS project were presented in a variety of forums: at the MedWorlds III conference in Salerno (2011), the Medieval Congresses in Leeds and Kalamazoo (2012), at the International Symposium on Boat and Ship Archaeology (ISBSA) meeting in Amsterdam (2012), and in the Courtauld Institute workshop ‘Beyond the Western Mediterranean’ organized by Sarah Guérin and Mariam Rosser Owen (2013). As the MISAMS Project at the University of Birmingham began in 2013, however, it modified these past efforts in two ways. First, with the help of Henry Chapman, it began collecting, collating, and superimposing its growing archaeological dataset within Geographic Information Systems (GIS). Second, as the key characteristic of an assemblage’s color-coded links was the area that the links occupied and not the decipherment of a specific route, that area was replaced graphically by a polygon (Figure 1 – the polygon for the 1st century AD assemblage Culip IV). The source or sources of items in an assemblage became vertices, and a polygon connected these vertices to the location of the assemblage on the seabed.
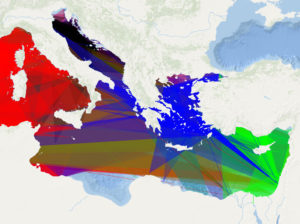
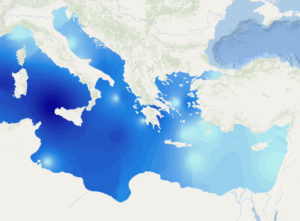
The use of these polygons had interpretive and representational advantages. The interpolative algorithms common to GIS could more easily accommodate a suite of polygons than a suite of links. Visually, the polygons more clearly represent the area in which past activity was most likely occurring, and each polygon could be color-coded like the links: western-Mediterranean sources add red to a polygon, sources in the Adriatic add black, sources from the Aegean are blue, and the eastern Mediterranean is green. These colors may also be combined in proportions that match the proportions of material in an assemblage. Moreover, superimposing the color-coded polygons generates a Mediterranean maritime space segregated into concentrations of color, presumably regions of ‘localized’ activity (Figure 2). Lastly, quantifying the varying density of the polygons across Mediterranean space visualizes the anisotropic nature of maritime activity in antiquity (Figure 3).
The last step in finalizing this interpretive methodology was a technical one that could only be completed with the release and updating of ArcGIS Pro. In earlier versions of ArcGIS (10.4 was used for the majority of the visualization and processing prior to 2019), rasters could visualize the varying densities of past activity, like Figure 3, but the color could only vary from dark to light shades. This meant that a raster could be generated to portray the varying density of ‘localized’ activity, but only for one region because only one color could be used. For example, superimposing a density model in red (for the western Mediterranean) over a model in blue (for the Aegean) would obscure all the shades of blue. ArcGIS Pro, however, can generate rasters with colors of varying levels of transparency, meaning that two or more density rasters, with colors representing activity in different regions, can be generated and superimposed without dramatically obscuring each other.
Data Collection
Invariable for a project that compiles and interpolates a large corpus of data is an equally extensive corpus of sources. While this research began by using data from A.J. Parker’s 1992 catalogue of sites in the Mediterranean Sea, support from the Honor Frost Foundation in 2015 enabled an extensive search and collation of new data. This additional information dramatically expanded the size of the dataset, and incorporated results drawing upon more recent typological and source analyses. The majority of the sources listed below were searched for additional information published between 1990 and 2016, the year this research occurred in libraries in Türkiye, Cyprus, and Israel, although data collection is still ongoing and new sources will be added to this list. Future work will occur in libraries in the western Mediterranean to balance this eastern-Mediterranean bias.
To be useful to this project, data found in these sources needs to meet two criteria. First, the published information must have been vetted in some fashion; most commonly through a formal peer-review process and, less commonly, through an editorial process only. Second, the information also needs to contain certain information: a date, a location, and the source or typological style of items in the assemblage.
Among the journals searched, those that contained information added to the AMD dataset are in boldface. A current list of the assemblages used in AMD modeling is available here.
- Abr-Nahrain
- Ägypten und Levante
- American Journal of Archaeology
- Anadolu Akdenizi Arkeoloji Haberleri / News of Archaeology from Anatolia’s Mediterranean Areas
- Anatolian Studies
- Anatolica
- Ancient Near Eastern Studies
- Annual of the American School of Oriental Research
- Annual of the British School at Athens
- Annual Report of the Department of Antiquities Cyprus
- Araştırma Sonuçları Toplantısı
- Archaeologia Cypria
- Archaeology and History in the Lebanon
- ‘Atiqot
- Berytus
- Bulletin d’Archéologie et d’Architecture Libanaises
- Bulletin d’Études Orientales
- Bulletin of the American Schools of Oriental Research
- Bulletin of the Anglo-Israel Archaeological Society
- Centre d’Études Chyproites
- Egyptian Archaeology
- ENALIA
- Hadashot Arkeologiyot, Excavations and Surveys in Israel
- Hesperia
- Israel Exploration Journal
- Journal of Egyptian Archaeology
- Journal of Field Archaeology
- Journal of Near Eastern Studies
- Journal of Palestinian Archaeology
- Journal of Roman Archaeology
- Journal of the American Research Center in Egypt
- Les Annales Archéologiques Arabes Syriennes
- Levant
- Mediterranean Archaeology, Australian and New Zealand Journal for the Archaeology of the Mediterranean World
- Opuscula Atheniensia
- Orient, Reports of the Society for Near Eastern Studies in Japan
- Palestine Exploration Quarterly
- Progress in Underwater Science
- Report of the Department of Antiquities Cyprus
- Studies in Ancient Art and Civilization
- Syria
- Archéologie, Art et Histoire
- Tel Aviv, Journal of the Institute of Archaeology of Tel Aviv University
- The International Journal of Nautical Archaeology
In addition to the journals searched, a collection of monographs, reports, and edited collections have also supplied information:
- Ancient Akamas I. Settlement and Environment
- Journal of Roman Archaeology, Supplementary Series
- Caesarea Papers. Straton’s Tower, Herod’s Harbour, and Roman and Byzantine
- Egypt’s Sunken Treasures
- Istanbul: 8000 Years Brought to Daylight
- Le navi antiche di Pisa
- Ancient Shipwrecks of the Adriatic
- Proceedings of the International Symposium Cyprus and the Sea
- Res Maritimae, Cyprus and the Eastern Mediterranean from Prehistory to Late Antiquity
- Stories from the Hidden Harbor, Shipwrecks of Yenikapı
- The Ancient Harbour and Anchorage at Dor, Israel.
- The ‘Old Ships’ of the ‘New Gate’
- The Roman Port and Fishery of Cosa
- Transport Amphorae and Trade in the Eastern Mediterranean
Methodology
Following the release of ArcGIS Pro, it is now possible to create and to superimpose density rasters with color codes that represent the contents of the assemblages being portrayed. Fundamental to the potential analyses in AMD, then, are two elements. Datasets of information, projected as points or polygons, are one element, and the second is the color-coding process.
Shapefiles with associated spreadsheets: Assemblages, Sources, and Polygons.
- Shapefile of Assemblages: The AMD Project starts by plotting the locations of assemblages on the seafloor as a series of points arrayed across the Mediterranean Sea. To avoid misrepresentations, not all of these collections on the seafloor are necessarily shipwrecks, nor are they labeled as such. Instead, in this study each is labeled as an assemblage – this could be a large collection of material or a shipwreck, or a single item on the sea floor. Site was avoided as, in some reports, a site is composed of numerous assemblages and single items, but not vice versa. The assemblages’ points are stored in a spreadsheet in ArcGIS with fields recording their contents, name, approximate date, and bibliographic reference, among other data. With these fields, it is possible to segregate between assemblages drawn from Parker’s dataset and those published elsewhere after 1990, or contrast assemblages with material from only one source to those with material from multiple sources.
- Shapefile of Sources: Each of the sites in the Site Dataset has material originating from one or more locations in the Mediterranean region. Some of these sources are indicated geographically, and could be specific, such as Corinth, slightly broader, like Campania, or particularly broad spatially, such as Gaul or Egypt. Other sources may be roughly extrapolated from a typological style, such as Dressel 1B, Late Roman Type III, or African Red Slip ware. Geographically-specific sources are ideal, but are not always available. When possible a single dot is plotted at the source of the material. When not possible, more dots are placed in the region representing the general source of the item. Three dots are arrayed between Libya and Tunisia, for example, to represent the general area where North African type amphorae are produced. Four dots are dispersed along the Adriatic coastline of Italy to represent the general source of Dressel 6 amphorae. This information is under continual refinement, however, and if you would like to improve the resolution of our models, please feel free to contact us with more information.
- Shapefile of Mobility Polygons: Once the assemblages’ locations on the seabed have been plotted, and the sources’ locations on land have been established as well, then the mobility polygon representing the likely area of the assemblage’s movement can be generated. The source or sources of each item in the assemblage became vertices of the polygon, and the location of the assemblage on the seafloor becomes the final point along the polygon’s edge.
Color Coding
Assigning colors to the projected polygons, or to the subsequent rasters, is done both numerically and visually. Among the fields within the Assemblages Shapefile should be four to record the color value for four of the five basins in the Mediterranean: the western basin, the Adriatic, the Aegean, and the eastern Mediterranean. As mentioned in the Background section, these regions had particular colors: red, black, blue, and green. The Ionian Sea was not included because it has the lowest number of assemblages, and none of these assemblages carry items from the Ionian Sea itself. The Ionian Sea, it seems, is a place of transshipment.
The numerical values for these fields are determined with the following variables:
- N = Total number of sources for the assemblage
- Xw = Total number western-Mediterranean sources for the assemblage
- Xad = Total number of Adriatic sources for the assemblage
- Xag = Total number of Aegean sources for the assemblage
- Xe = Total number of eastern-Mediterranean sources for the assemblage
And the constant 256, which is the highest color value in the RGB color scale within ArcGIS.
To calculate the color value for an assemblage with items from three sources in the western Mediterranean, use this equation:
(256/N) x Xw = Red color value in RGB color scale
(256/3) x 3 = 256
In the RGB color scale in ArcGIS, the red value should be 256, and green and blue should be zero. This color is then applied to the appropriate polygon.
Similarly, the color value for an assemblage with items from 7 sources in the Aegean is determined:
(256/N) x Xag = Blue color value in the RGB color scale
(256/7) x 7 = 256 blue
In the RGB color scale, the blue value should be 256, and the red and green should be zero. This color is then applied to the appropriate polygon.
The color value for an assemblage with items from five sources in total, but two sources are in the Aegean and three sources are in the eastern Mediterranean:
(256/5) x 2 = 102 blue
(256/5) x 3 = 153 green
In the RGB color scale, the blue value should be 102 and the green should be 153; red should be zero. This color is then applied to the appropriate polygon.
Once the mobility polygons representing the most likely area of movement for each assemblage have been plotted, and the colors for each polygon have been determined, it is possible to conduct a variety of geo-spatial analyses and project the results. The results can be generated in two forms: projections of superimposed and color-coded polygons, or rasters displaying varying densities of activity. For a detailed discussion of these projections and rasters, please click here.
Geo-Spatial Analyses
Textual and Archaeological Maria in the Eastern Mediterranean
With the completion of the data collection in 2016 supported by the Honor Frost Foundation, it meant that the dataset of assemblages in the eastern Mediterranean basin was now substantially larger than that presented in Parker’s 1992 catalogue, and more up-to-date as well; it contained the results of new analytical investigations and refinements of ceramic typologies. With this larger corpus of information, it also meant that the projection and modeling of patterns of activity in the eastern basin could be more meaningful statistically. The first results using this expanded dataset were presented at the 2016 Connecting Cultures Conference in Lefkoşa, Cyprus, organized by Vasıf Şahoğlu, Müge Şevketoğlu, and Yiğit Erbil. At this event, a straightforward hypothesis was investigated: If ancient writers’ maritime geographies emerged from the everyday use and valorization of maritime space, then the places recognized in these texts should coordinate spatially with concentrations of maritime activity emerging from these archaeological models.
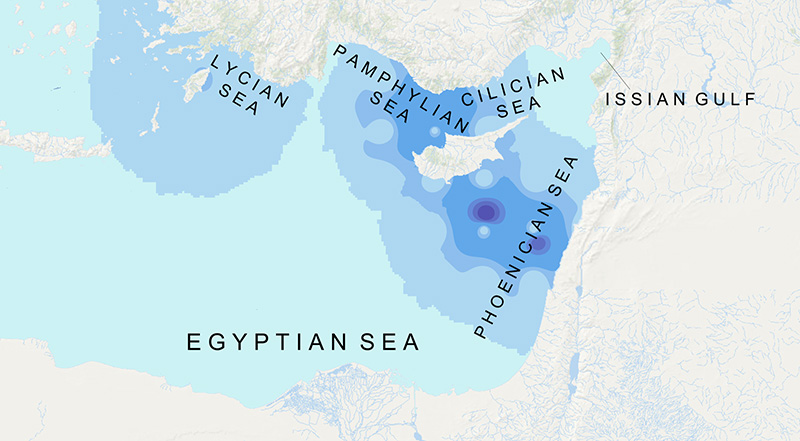
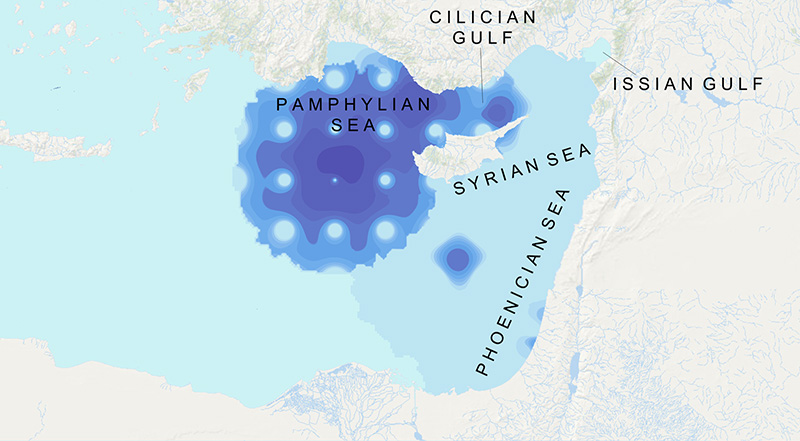
What emerged through this testing was that some writers’ portrayals of maritime space, such as that by Pomponius Mela in the 1st century AD, oriented poorly with the archaeological data (Figure 1). Other writers’ geographies, however, coordinated more closely. Pliny the Elder’s Lycian, Pamphylian, Cilician, and Phoenician Seas overlap well with the concentrations of activity in the 1st century AD projected by the archaeological models (Figure 2), as does the geography of Saint Orosius from the 5th century AD (Figure 3).
The parallels that emerge from this comparison are promising, and suggest that these two independent sets of data are portraying similar phenomena. Where there appears to be a greater density of maritime activity – a social phenomenon that creates a place from space, as argued by Lee and Ingold (2006), Ur (2009), Leary (2014), and Lucas (2014) – textual sources have a toponym for the place in question. These maritime places, as loci of activity and elements of a formalized geography of the sea, thus have a value that transcends the social boundaries between sailors and the literate historians and clergy recording the world. Nevertheless, some issues are still open to questions. How much of this coordination is a coincidence, and how much is the result of the transfer of knowledge? For a former naval commander like Pliny the Elder, with aides compiling data for his scholarship, it seems more likely that his geography represents the latter. But, for Pomponius Mela, do the discrepancies represent a failing on his part to represent or record these maritime places accurately? Or, are his models instead presenting one cartography of a space shared and perceived in many different ways?

Maritime Micro-Regions of the Western Mediterranean
The 3. Arbeitstreffen der Forschungsgruppe ‘Hafenorte’ / 3rd Workshop of the Research Group ‘Harbour Cities’ organized by the Deutsches Archäologisches Intitut Istanbul in 2017, became a second opportunity to explore other applications of this density modeling and what these concentrations of activity may represent. As part of a series of workshops investigating the forms, spaces, and ways of cultural interaction, the focus of the event was the systemic relationship between port installations large and small, formal and informal, their associated cities, and their respective micro-regions. The efforts of the AMD project were included in the event as an opportunity to expand the topic beyond the shoreline: just as we may investigate coastal micro-regions, can the concept be applied to maritime space as well?
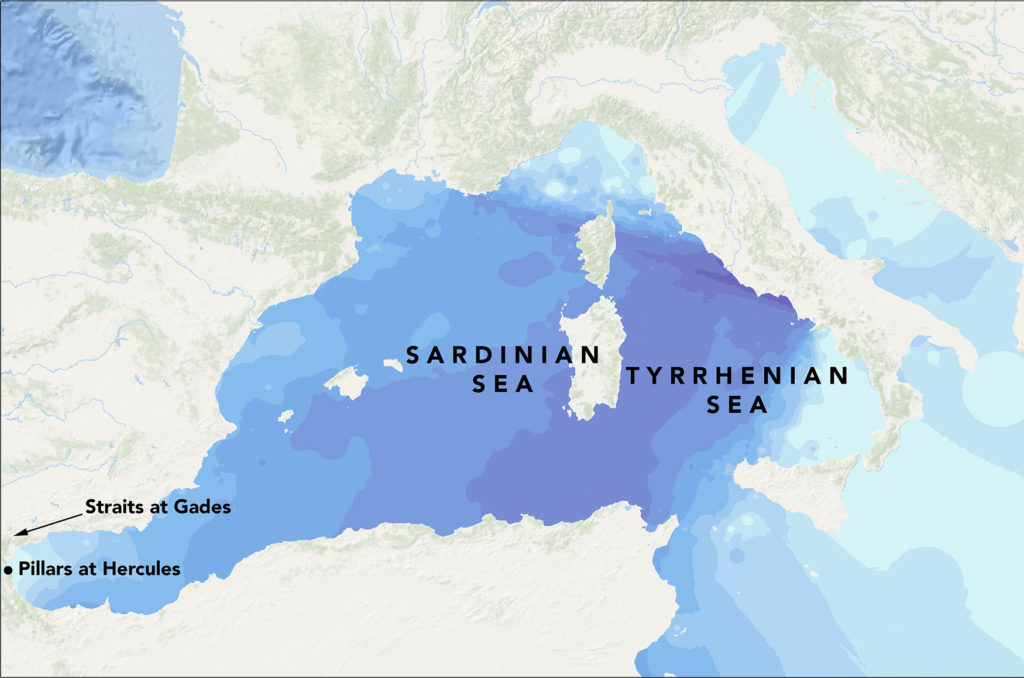
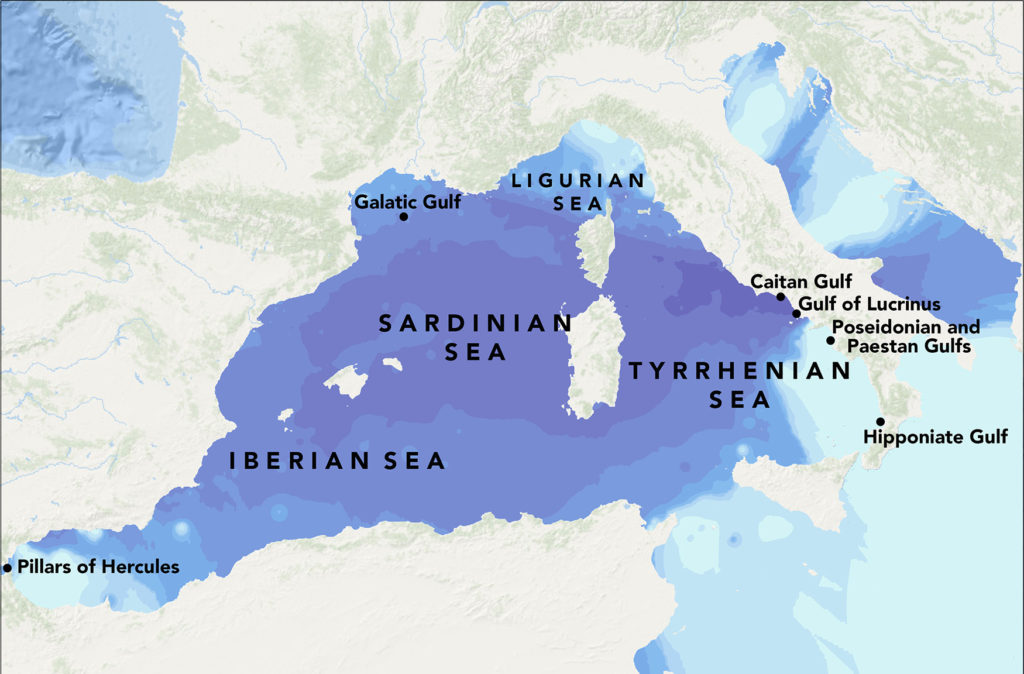
These questions were tested within western-Mediterranean maritime space from the 3rd to the 1st centuries BC, with a dataset of 288 assemblages from the same period. One key to this testing was modeling maritime places in the western-Mediterranean basin. The previous work in the eastern Mediterranean modeling the varying densities of activity formed a methodological foundation, while studies arguing that an area of concentrated and repeated movement can become a place contained the necessary theoretical foundation. Equally, ancient geographies of the western basin by Eratosthenes, Polybius, and Strabo contained geographies of the space as well. The other key for this study was Horden and Purcell’s concept of a micro-region. For them, one characteristic was ecological variability, like the Beqaa Valley. A second was fluctuating levels of human engagement dependent upon personal and communal need.
Defined by these two criteria, the Sardinian / Sardoan Sea and the Tyrrhenian Sea could be defined as maritime micro-regions. Each has the necessary ecological diversity and, as proposed in the archaeological modeling, they have varying levels of engagement over the three centuries in question. Similar to micro-regions on land, their have a spatial constancy and their presence consists of more than a toponym; instead, the densities of activity within them also suggest their importance within this maritime landscape. Similar to the previous study in the eastern Mediterranean, however, pertinent issues remain. For example, on land a third criterion of a micro-region is its strong association with a particular natural environment. This could be the mountains of the Beqaa Valley, or the Apennine and Alban hills of South Etruria. To speak of and to recognize these natural features is to simultaneously identify the micro-region. How is the Tyrrhenian Sea distinguished from other parts of the western basin, however? Equally, if a toponym signifies the presence of the micro-region, what if that toponym disappears from use? Lastly, what of the other maritime places in Strabo’s geography that do not correspond with densities of activity?

Sicily: A Frontier in the Center of the Sea?
Whereas the previous studies investigated constructions and use of maritime space, the workshop organized by Luca Zavagno, “Islands at the Frontier of the Empires in the Middle Ages” at Bilkent University, Ankara, in 2018 investigated edges. Where are the boundaries of empires and communities? How are they represented, how are they perceived, and how might they be identified today? Within the AMD Project, these questions are particularly pertinent: Evident in models made as early as 2013 are gradients or frontiers between concentrations of activity. One appears in the south eastern corner of the Aegean Sea, and a second appears just to the east of Sicily. What is unclear, however, is the resiliency of these gradients – how long do they last? Or, how dependent are they on geography or human activity?
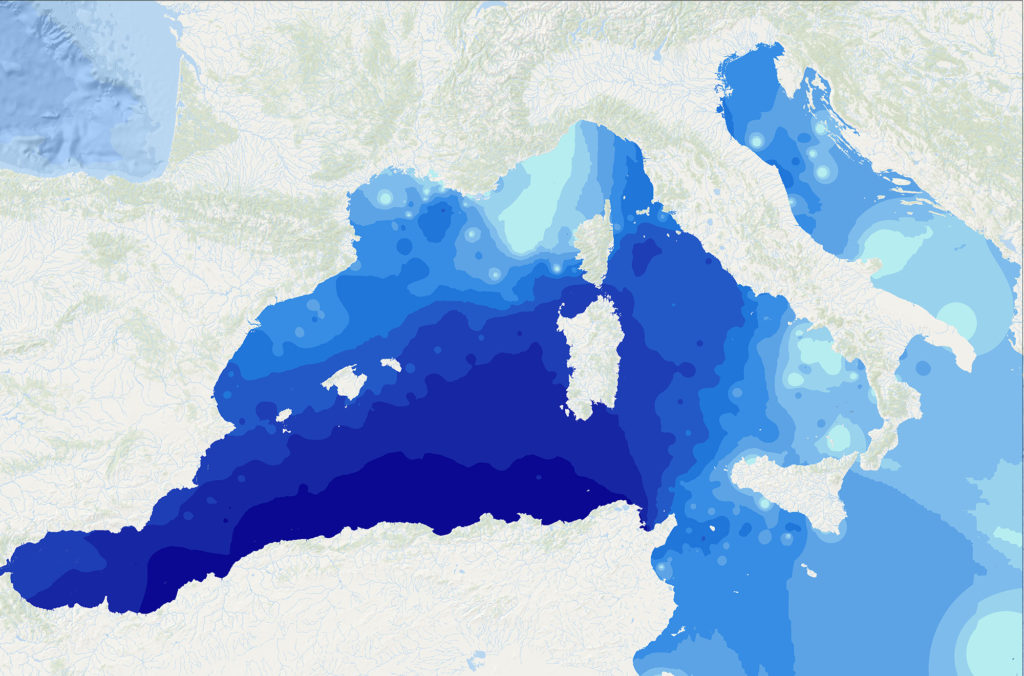
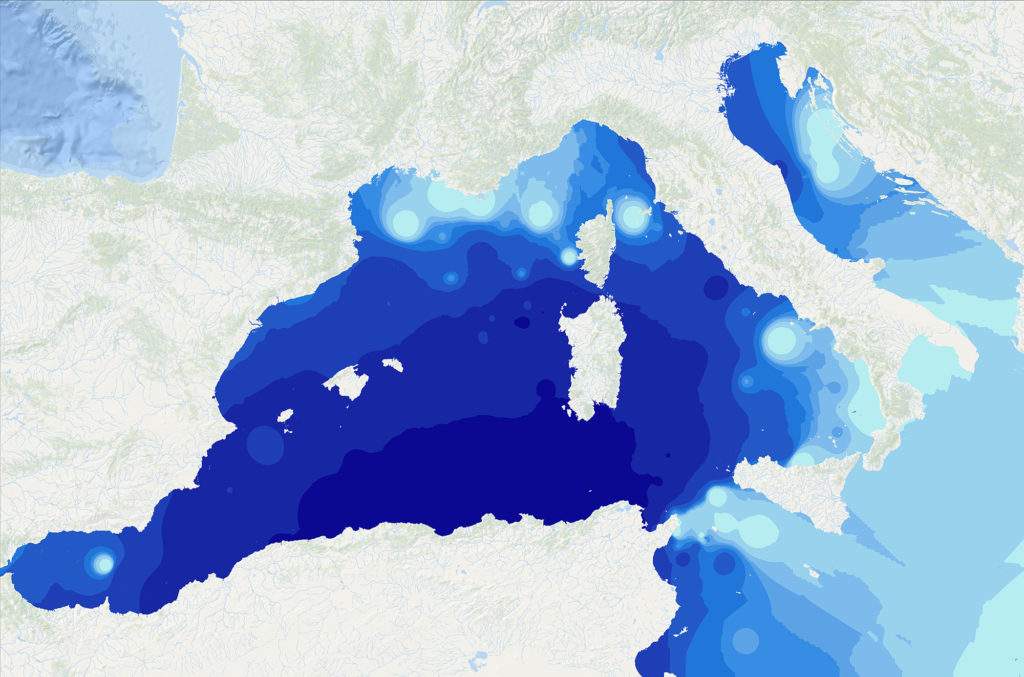
Using a dataset of 449 assemblages containing only material from the western Mediterranean, polygons for each assemblage were projected then segregated on a centennial basis from the first to the seventh centuries AD. Importantly, these assemblages were chosen because they each contain items only from the western Mediterranean basin, they are not assemblages only found within the western basin. This means that assemblages throughout the Mediterranean Sea were used, although each only contained items from the western portion of the sea. Variations in the density of the polygons were used to create a series of rasters illustrating concentrations of activity in each century.
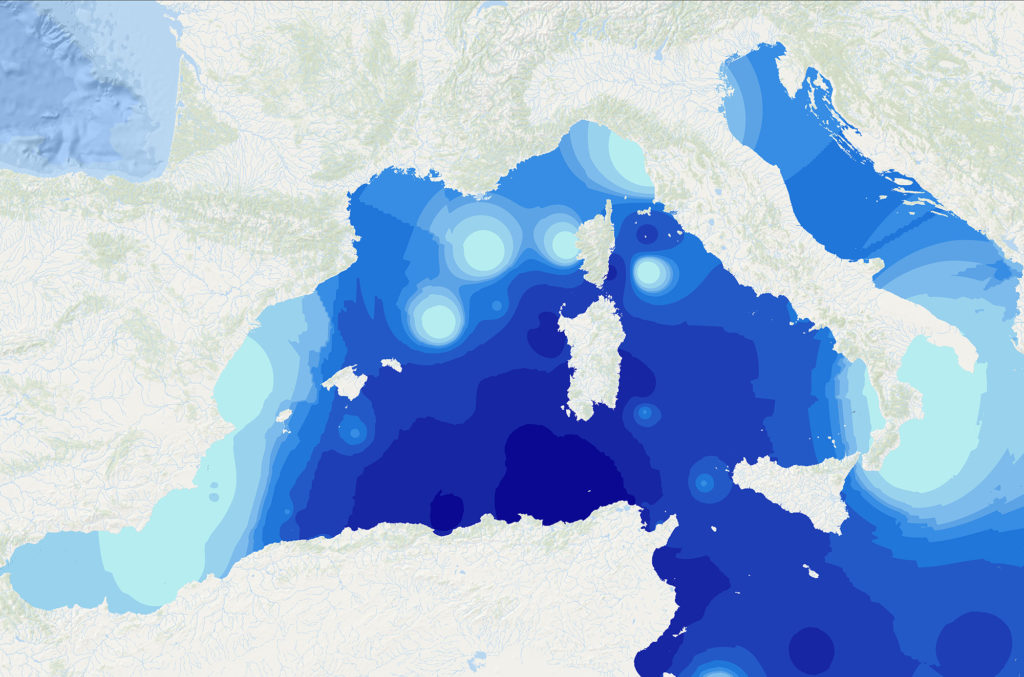
The results of this analysis suggest that between the first and fifth centuries AD, maritime activity was much more likely to constrain the movement of materials originating within the western basin to that space, than to move the items farther eastwards (Figures 1 and 2). For these centuries, a boundary or gradient appears to distinguish waters to the east and south of Sicily from the waters to the west. As there is no environmental or technological impediment to movement farther eastwards, however, this gradient is much more likely a social construct. Moreover, while the gradient’s longevity suggests that it was tied to the presence of the island, the gradient’s segregation of western maritime activity also suggests the presence of a distinct maritime community in the waters west of the island. By the sixth century AD and later, however, this gradient seems to be much more permeable (Figure 3).
This perception that a western Mediterranean maritime community existed as a distinct social group may have reinforcement in the archaeological record. Among the mosaics of navicularii and negotiatores at the Piazzale delle Corporazioni at Ostia, fourteen record the home cities of the individuals in question. Of those fourteen, eight come from places west of Carthage. Similarly, gravestones demonstrate that navicularii born around the western basin were buried in that region, whereas naukleroi born farther east were buried in a wider variety of locales.
Archaeological Field Work
In addition to the ongoing compilation of published data, the AMD project also encompasses fieldwork to collect raw data that can test and add to future analyses. Presently, these fieldwork efforts encompass investigations along the Amalfi peninsula, in Italy, and the Karaburun peninsula, in Türkiye.
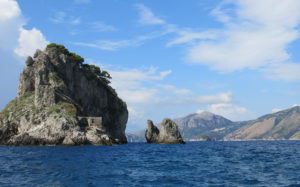
Fieldwork along the Costiera Amalfitana
There are numerous reasons to study the maritime landscape of the Amalfi coastline in Campania, Italy. The rugged geology and deep river valleys have made the area’s settlements dependent on maritime activity for communication, movement, resources, trade, and revenue. Similarly, the area between Salerno and Capri has been continually occupied since the Lower Paleolithic, and the Duchy of Amalfi was one of the four founding maritime republics of Italy, with Venice, Genoa, and Pisa. The area is a rich palimpsest of private, commercial, public, sacred, and secular maritime spaces, and as much as the Bay of Salerno may be viewed as an isolated unit, it is equally integrated with the Tyrrhenian Sea and other spaces farther east and west.
In addition to these reasons, this survey began in 2016 prompted by preliminary results from the AMD project. According to the modeling, much of the Tyrrhenian Sea to the south of this peninsula had strong inter-regional connections farther eastwards. Yet, the waters north of this peninsula did not, suggesting that either the peninsula, or the bays to the north and south, represented a socially-constructed gradient between these two types of activity. With the generous permission of the Soprintendenza Archeologia Belle Arti e Paesaggio di Salerno e Avellino, the Consorzio di Gestione Area Marina Protetta Punta Campanella, and in collaboration with the Centro di Cultura e Storia Amalfitana and the Centro Sub Costiera Amalfitana, our project is collecting data to model changes in this coastline’s maritime landscape and to test the AMD project’s conclusions.

Fieldwork at Karaburun, Türkiye
Since 2015, Dr. Çiler Çilingiroğlu of Ege University and her team have been conducting field surveys of the Karaburun peninsula, south of Izmir. Their efforts have yielded a rich collection of prehistoric sites, as well as an unexpected collection of at least five coastal sites from the Roman era. In 2017, KUDAR joined Dr. Çilingiroğlu’s project to focus on these coastal structures and the adjacent waters.
Among these five sites, three at Boyabağ, Engicili Burnu, and Olcabük have been examined and preliminarily documented, and each appears to be a small production or distribution center for local products. The general architectural style and construction of each site is similar, similar suites of coarsewares are found at each and, at Boyabağ and Olcabük, screw-press weight stones for the production of olive oil were found. A fourth site nearby, at Sıcakbük, may be a local kiln producing the ceramics and roof tiles found in the region. As this work progresses, we hope to generate a thorough catalogue of the coastal settlements along the peninsula’s coastline and, once available, data from these surveys will be incorporated into the AMD project as well.